Newsletter Subscribe
Enter your email address below and subscribe to our newsletter
Enter your email address below and subscribe to our newsletter
All voices matter
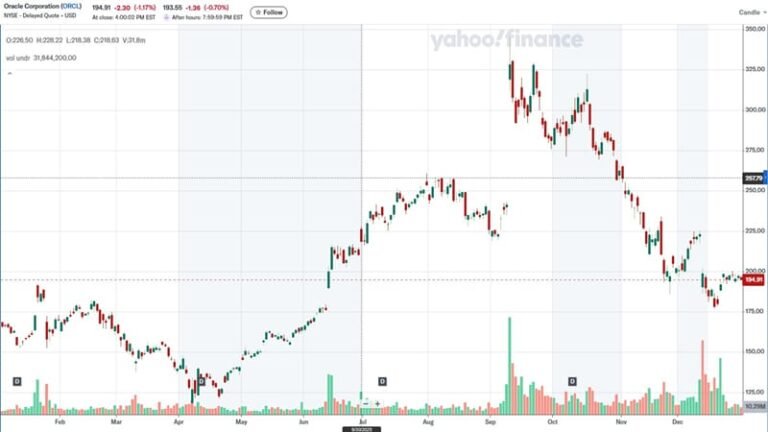
If you’ve ever watched a stock chart spike or plummet and wondered what invisible forces are at play, you’re not alone. Understanding what moves individual stock prices isn’t just academic; it’s essential for making informed decisions that protect your portfolio. In this deep dive, we’ll unpack the core drivers, from supply and demand basics to broader economic signals, drawing on real-world examples to help you spot opportunities and avoid pitfalls.
At its heart, a stock’s price boils down to the age-old economic principle of supply and demand. When more investors want to buy shares (high demand) than sell them (low supply), prices climb. Conversely, if sellers outnumber buyers, prices drop. This plays out in real time on exchanges, where bids (what buyers offer) and asks (what sellers want) negotiate every trade.
Think of it like an auction: A hot tech stock might surge if a breakthrough product announcement draws in buyers, tightening supply as holders cling to their shares. On the flip side, a scandal could flood the market with sellers, crashing the price. Liquidity matters here too—highly traded stocks like Apple move smoothly on news, while thinly traded ones can swing wildly on small orders. In practice, I’ve advised clients to watch trading volume as a clue; spikes often signal incoming price shifts.
No factor influences individual stock prices more directly than a company’s underlying performance. Earnings reports, released quarterly, are make-or-break moments. Strong profits and upbeat guidance can send shares soaring, while misses or gloomy outlooks trigger sell-offs. But it’s not just about the numbers—it’s the story they tell about future potential.
For instance, consider how Amazon’s consistent revenue growth from e-commerce and cloud services has propped up its valuation, even during market dips. Metrics like earnings per share (EPS), price-to-earnings (P/E) ratios, and free cash flow reveal if a stock is undervalued or overpriced. A low P/E might signal a bargain if growth prospects are solid, but high debt levels (measured by debt-to-equity ratios) could warn of risks. Long-term investors thrive by focusing here, as I’ve seen time and again: Companies with robust fundamentals weather storms better than hype-driven ones.
Stock prices aren’t always rational—they’re swayed by the collective mood of the market. Sentiment, rooted in behavioral finance, can amplify or override fundamentals. Positive buzz from a viral product launch or celebrity endorsement might inflate a stock beyond its worth, while fear from geopolitical tensions can tank it unfairly.
Take the dot-com bubble: Internet stocks ballooned on hype alone, only to crash when reality hit. Today, social media and news cycles accelerate this; a single tweet can move markets. In my experience, sentiment-driven swings create buying opportunities—savvy investors buy when others panic sell. Tools like sentiment analysis from news aggregators help gauge this, but remember: Emotions fade, and fundamentals endure.
Individual stocks don’t exist in a vacuum—they’re tugged by macroeconomic tides. Interest rates are a prime mover: Low rates cheapen borrowing, boosting corporate profits and stock appeal over bonds. Hike them, and stocks suffer as money flows elsewhere. Inflation erodes purchasing power, squeezing margins, while GDP growth signals healthy consumer spending.
Sector-specific trends amplify this. Energy stocks rise with oil prices during booms but falter in recessions. Global events, like trade tariffs or currency fluctuations, hit multinationals hard—think how U.S.-China tensions battered tech exporters. Monitoring reports like jobs data or CPI releases is key; they’ve tipped me off to sector rotations more than once.
While fundamentals set the stage, technical analysis spots the timing. Price patterns, moving averages, and indicators like the Relative Strength Index (RSI) reveal momentum. An upward trend might gain steam as “success breeds success,” drawing in more buyers, while reversals signal exits.
For example, a “head and shoulders” pattern often precedes drops, as seen in many overvalued stocks post-earnings. Liquidity discounts in small-caps or demographic shifts (aging populations selling for retirement) add layers. Traders live by these, but I caution long-term folks: Technicals guide entry points, not core holdings.
Unexpected news can jolt prices instantly. Mergers boost targets but dilute acquirers; regulatory probes sink sectors overnight. Dividends and buybacks reward holders by reducing supply, while new share issuances flood it.
High-frequency trading algorithms exacerbate volatility, turning minor news into major moves. Political shifts, like elections, inject uncertainty—stocks often dip pre-vote, then rally on clarity. Staying informed via reliable sources is crucial; it’s saved my clients from knee-jerk reactions countless times.
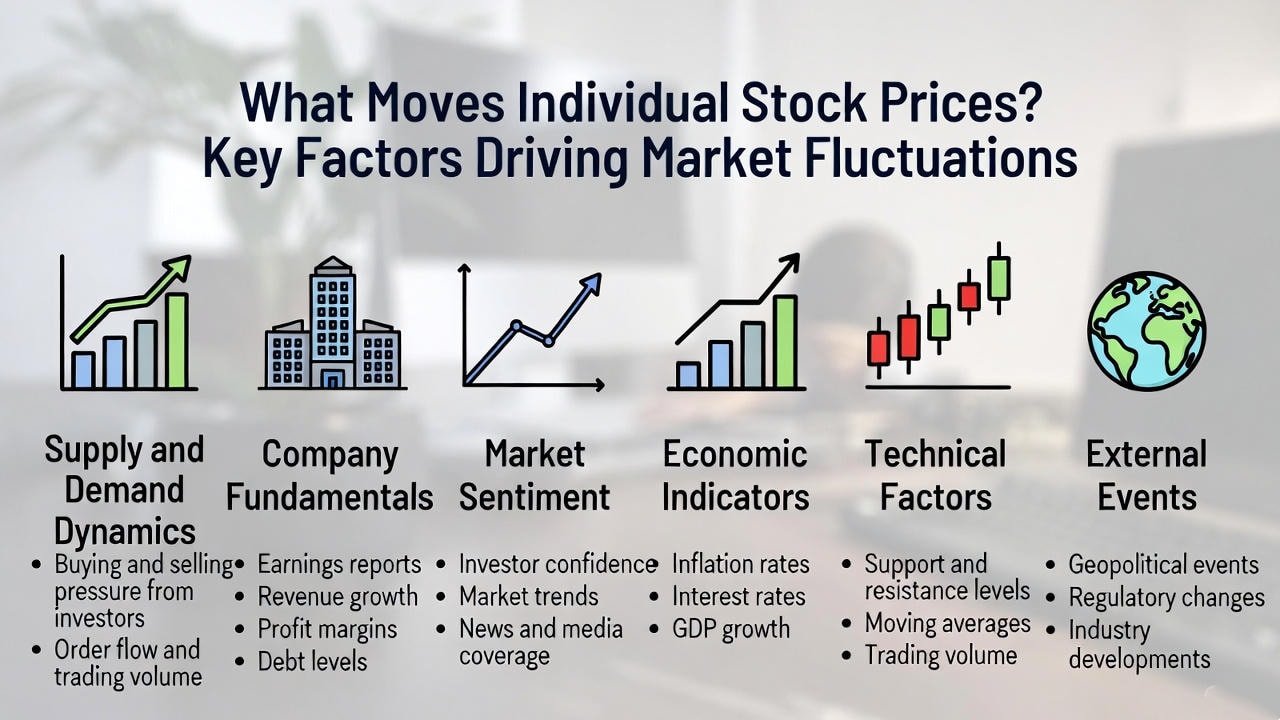
To tie it all together, here’s a breakdown of the main factors influencing stock prices, with real-world examples to guide your analysis:
| Factor | Explanation | Example |
|---|---|---|
| Supply and Demand | Balance of buyers vs. sellers sets the price; high demand pushes it up. | Tech stock surges on product hype. |
| Company Fundamentals | Earnings, growth, and valuation metrics reflect intrinsic value. | Amazon’s EPS growth sustains highs. |
| Market Sentiment | Investor emotions and perceptions drive short-term swings. | Dot-com bubble fueled by optimism. |
| Economic Indicators | Rates, inflation, and GDP impact profitability and appeal. | Rate hikes pressure growth stocks. |
| Technical Factors | Chart patterns and momentum influence timing. | RSI signals overbought conditions. |
| External Events | News, mergers, and global shifts cause rapid changes. | Tariffs hit export-dependent firms. |
Armed with these insights, you’re better equipped to navigate stock movements. Start by blending fundamentals for long-term picks with sentiment and technicals for timing. Diversify to buffer macro risks, and always verify news before acting—fakeouts are common. If a stock’s price seems detached from reality, dig deeper; it might be your next big win or a trap to avoid. In the end, what moves individual stock prices is a tapestry of data and decisions—master it, and you’ll turn market chaos into calculated gains.