Newsletter Subscribe
Enter your email address below and subscribe to our newsletter
Enter your email address below and subscribe to our newsletter
All voices matter
In the fast-paced world of finance and investing, few metrics carry as much weight as Gross Domestic Product, or GDP. It’s the go-to measure for gauging a country’s economic health, and savvy investors keep a close eye on it because it can signal everything from booming growth to looming recessions. But what exactly is GDP, and why does it send ripples through stock markets, bond yields, and currency values? In this in-depth guide, we’ll break it down step by step, drawing on real-world examples and expert insights to help you understand its implications. Whether you’re a seasoned trader or just dipping your toes into economic analysis, grasping GDP could be the key to making smarter investment decisions.

At its core, Gross Domestic Product represents the total monetary value of all goods and services produced within a country’s borders over a specific period—usually a quarter or a year. Think of it as a snapshot of economic activity. Economists calculate it in a few ways: nominal GDP (raw figures without adjusting for inflation) and real GDP (adjusted for price changes to show true growth).
The concept dates back to the 1930s, when economist Simon Kuznets developed it during the Great Depression to help policymakers track recovery efforts. Today, it’s a cornerstone of economic reporting, released by government agencies like the U.S. Bureau of Economic Analysis (BEA) or the UK’s Office for National Statistics. But GDP isn’t perfect—critics argue it overlooks factors like environmental impact or income inequality. Still, for markets, it’s indispensable because it quantifies output in a way that’s comparable across nations and time periods.
To put it in perspective, the U.S. GDP hit about $27 trillion in 2023, making it the world’s largest economy. China follows closely, but when adjusted for purchasing power parity (PPP), it sometimes edges ahead. These figures aren’t just trivia; they influence everything from corporate earnings to global trade policies.
GDP isn’t a single number pulled out of thin air—it’s built from four main pillars, often summarized by the formula: GDP = C + I + G + (X – M). Here’s what each letter stands for:
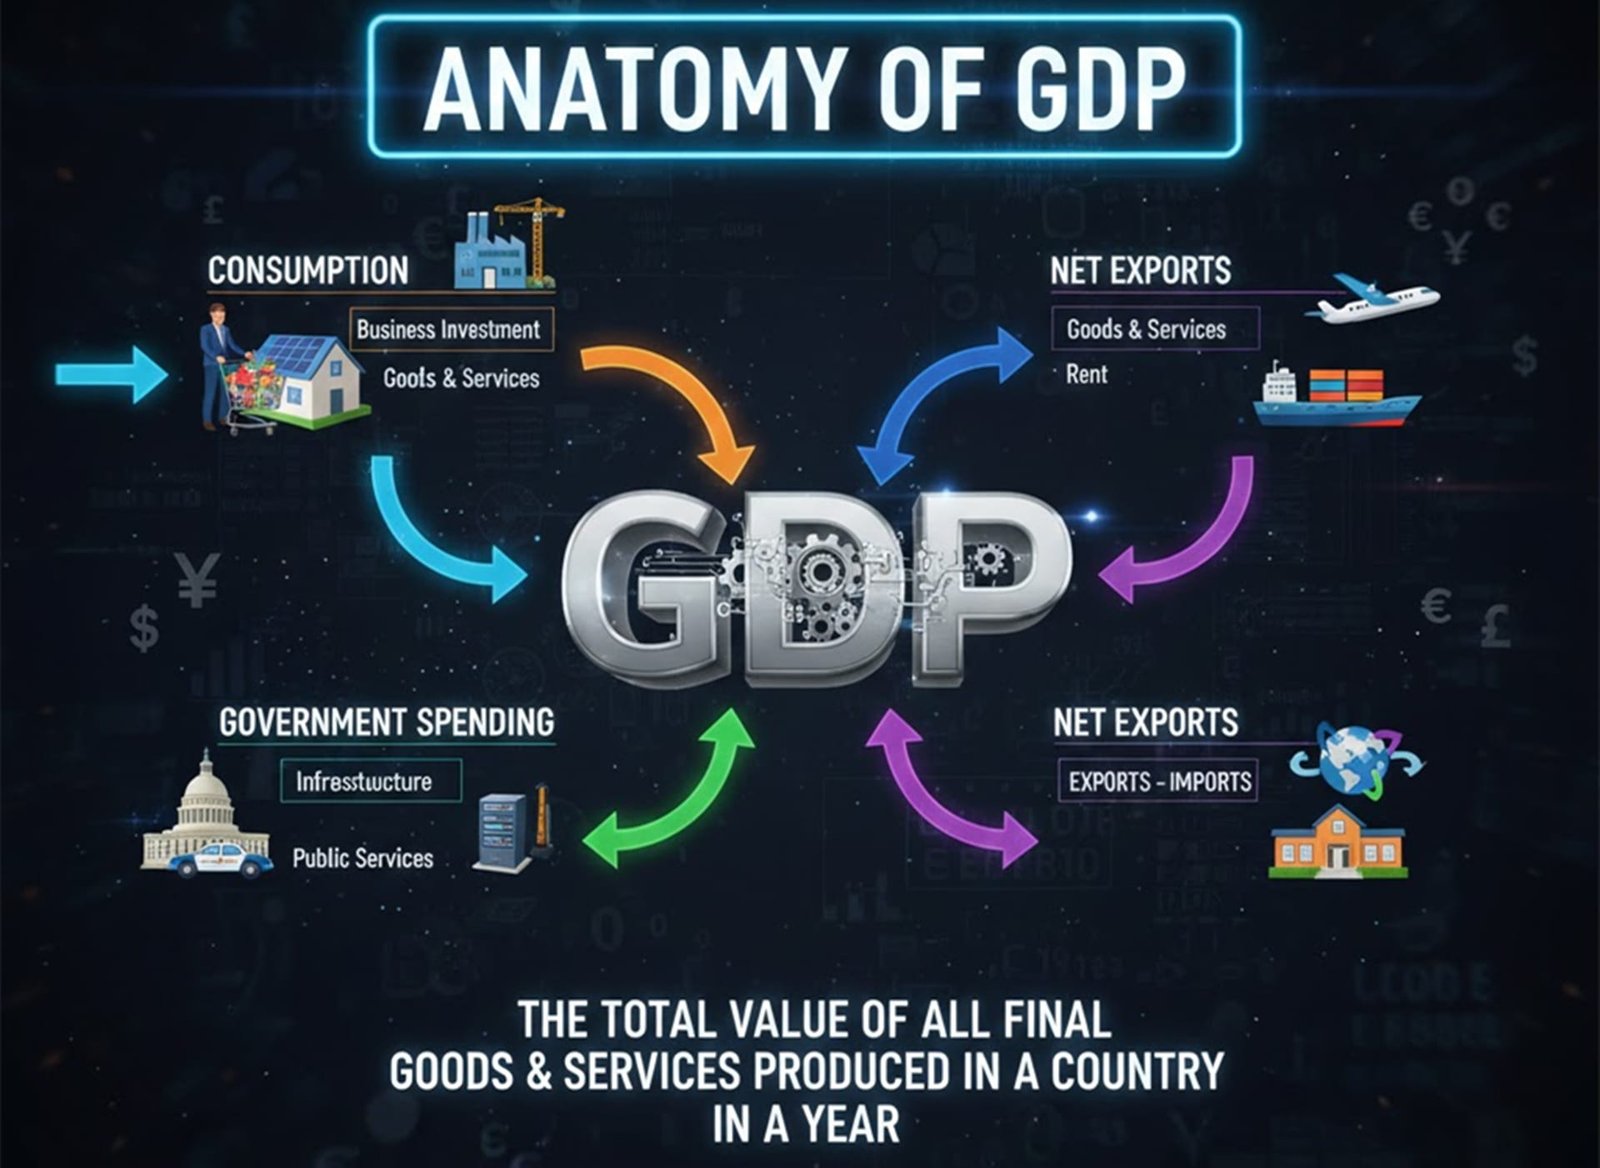
To visualize this, here’s a simple table showing the approximate breakdown for a major economy like the United States based on recent data:
| Component | Percentage of GDP | Example Contributions |
|---|---|---|
| Consumption (C) | 68-70% | Household spending on goods and services |
| Investment (I) | 17-20% | Business capital and housing |
| Government (G) | 17-19% | Public infrastructure and welfare |
| Net Exports (X-M) | -2 to -5% | Trade balance (often a deficit in U.S.) |
This breakdown helps investors spot vulnerabilities. For instance, if consumption dips due to rising interest rates, it could foreshadow slower overall growth.
Markets are forward-looking beasts, and GDP data acts like a crystal ball—albeit a foggy one. When quarterly GDP reports come out, they can trigger immediate reactions: stocks might surge on strong numbers, or bonds could rally if growth looks anemic, signaling potential rate cuts from central banks like the Federal Reserve.
Consider the chain reaction: Robust GDP growth often means higher corporate profits, which lifts stock prices. But if growth is too hot, it might stoke inflation, prompting rate hikes that make borrowing costlier and slow things down. Conversely, weak GDP can spark fears of recession, pushing investors toward safe-havens like gold or Treasuries.
Historical events underscore this. During the 2008 financial crisis, plummeting U.S. GDP figures amplified the sell-off in equities, with the S&P 500 dropping over 50%. More recently, in 2020, the pandemic caused a sharp GDP contraction, but massive fiscal stimulus led to a V-shaped recovery that rewarded bold investors.
For global markets, GDP comparisons matter too. Emerging economies like India’s often boast higher growth rates (around 6-7% annually), attracting foreign capital and boosting their currencies. Traders use tools like GDP forecasts from organizations such as the IMF or World Bank to anticipate these shifts.
If you’re building a portfolio, ignoring GDP is like driving without a dashboard. Here’s how to incorporate it:
But don’t rely on GDP alone. Pair it with leading indicators like PMI surveys or unemployment rates for a fuller picture. Tools like Bloomberg terminals or free resources from Trading Economics can help track revisions, as initial GDP estimates often get updated.
Despite its prominence, GDP has blind spots. It doesn’t measure well-being—Bhutan’s “Gross National Happiness” index is a quirky alternative. Nor does it account for underground economies or unpaid work like childcare. In places like Sub-Saharan Africa, informal sectors can make official GDP figures misleading.
Another myth: Bigger GDP always means better. Rapid growth in China has come with environmental costs, reminding us that sustainable development matters. Markets are starting to factor in ESG (Environmental, Social, Governance) alongside traditional metrics.
In summary, GDP is more than an abstract number—it’s a vital signal that shapes market sentiment and investment opportunities. By understanding its components and implications, you can better navigate economic cycles and spot trends before they hit the headlines. Whether you’re eyeing the next Fed meeting or diversifying internationally, keeping tabs on GDP reports could give you that edge.
If you’re serious about investing, start by subscribing to alerts from reliable sources like the BEA or OECD. And remember, while GDP guides decisions, it’s just one piece of the puzzle—combine it with thorough research for the best results. What’s your take on the latest GDP figures? Share in the comments below.