Newsletter Subscribe
Enter your email address below and subscribe to our newsletter
Enter your email address below and subscribe to our newsletter
All voices matter
If you’ve been watching the markets in 2025, you might have felt that familiar unease when headlines screamed about the S&P 500 dipping into “correction territory” back in March or April. It’s a term thrown around a lot during volatile times, but what does it really mean for your portfolio? A market correction is essentially a short-term pullback where stock prices drop by at least 10% from their recent highs, often serving as a reality check after a strong rally. Far from a catastrophe, these events are a normal part of investing, and understanding them can turn fear into opportunity. In this guide, we’ll explore the ins and outs, backed by historical patterns and practical advice, to help you decide how to position yourself the next time one hits.
At its core, a market correction refers to a decline of 10% or more in a major stock index—like the S&P 500 or Dow Jones Industrial Average—from its most recent peak. It’s not a random event; it’s the market’s way of adjusting valuations that have gotten ahead of economic fundamentals. Unlike smaller dips (under 10%), corrections feel more pronounced, but they stop short of the 20% threshold that defines a bear market.
These pullbacks can affect individual stocks, sectors, or the broader market, and they often unfold over days to months. For instance, if the S&P 500 climbs to 5,000 and then falls to 4,500, that’s a classic correction. The key is retrospect: We only confirm it after the fact, once prices have rebounded or stabilized. Investors who grasp this avoid knee-jerk reactions, recognizing that corrections are temporary resets rather than signals of doom.
Markets don’t drop without reason. Corrections typically stem from a mix of economic signals, investor sentiment, and external shocks. Common triggers include disappointing economic data, such as rising inflation or weak job reports, which spark fears of slower growth. Geopolitical tensions—like trade disputes or elections—can also play a role, as can corporate earnings misses that reveal overoptimism in stock prices.
In overheated markets, where valuations stretch beyond sustainable levels (think high price-to-earnings ratios), a correction acts like a pressure valve, bringing things back in line with reality. Take the 2025 pullback: Lingering inflation concerns, coupled with global tariff talks, pushed the S&P 500 down about 15% over a couple of months, reminding everyone that endless bull runs aren’t guaranteed. No single factor dominates, but the result is the same—sellers outnumber buyers temporarily, leading to price adjustments.
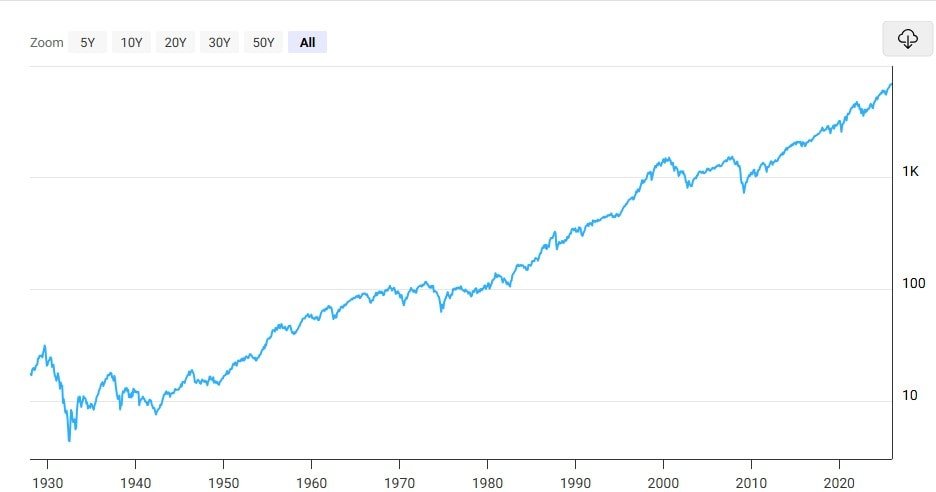
If corrections seem frequent, that’s because they are. Since 1974, the S&P 500 has experienced around 27 corrections, averaging about one every couple of years. They tend to be sharp but brief, lasting an average of four months, with the market recovering fully in most cases. Only a handful escalate into full bear markets, like in 2000 or 2007.
History shows resilience: The U.S. stock market has always bounced back, often posting stronger gains post-correction. For context, here’s a table highlighting some notable market corrections since 2000, drawing from key events and their impacts. (Data based on S&P 500 performance; recoveries measured to new highs.)
| Year/Event | Trigger | Peak-to-Trough Decline | Duration (Months) | Recovery Time (Months) |
|---|---|---|---|---|
| 2011 (Japan Earthquake/Tsunami) | Natural disaster and debt ceiling fears | -16% | 5 | 4 |
| 2018 (Inflation and Rate Hikes) | Bond market volatility and Fed policy | -14% | 3 | 4 |
| 2022 (Inflation/Supply Chains) | High inflation and geopolitical tensions | -19% | 9 | 12 |
| 2025 (Tariffs and Economic Data) | Global trade disputes and persistent inflation | -15% | 2 | 3 |
| 2020 (Early COVID Dip)* | Pandemic uncertainty (before full bear) | -12% (initial phase) | 1 | 2 |
*Note: The 2020 event quickly became a bear market but started as a correction. Past performance isn’t indicative of future results, but these patterns underscore that corrections are survivable—and often buying opportunities for patient investors.
It’s easy to confuse these terms, but the distinctions matter for your strategy. A correction is a moderate 10-20% drop, often healthy and short-lived. A bear market kicks in at 20% or more, signaling deeper economic issues and lasting longer—up to 14 months on average. Crashes are sudden, severe plunges (like Black Monday 1987’s 23% single-day drop), usually embedded in bears but not always predictive of long slumps.
The takeaway? Corrections prune excesses without derailing growth, while bears test endurance. Knowing where we stand helps you avoid overreacting.
Believe it or not, corrections aren’t all bad. They create entry points for undervalued stocks, weeding out speculative bubbles and rewarding fundamentals. Long-term data shows markets spend about a third of time in correction mode, yet annual returns average over 10%. For savvy folks, this means “buying the dip” on quality assets, potentially boosting future gains as the cycle turns.
When prices tumble, the real test begins. Here’s how to navigate:
Tools like robo-advisors or index funds make this easier for beginners.
The biggest error? Panic selling, which locks in losses and misses rebounds. Others include overtrading (racking up fees) or trying to time the bottom—statistically tough. Ignoring diversification leaves you exposed, as seen in sector-heavy portfolios during tech corrections. Solution: Stick to facts, consult an advisor, and focus on long-term goals over daily noise.
Market corrections test nerves but reward preparation. If you’re in it for the long haul (10+ years), treat them as sales. Shorter horizons? Prioritize stability. Assess your portfolio today: Are you diversified? Can you weather a 15% drop? If not, adjust now. Remember, every correction since 1927 has led to new highs. By staying informed and disciplined, you’ll not just survive but thrive. Ready to review your investments? Start with a simple asset check— it could make all the difference in the next pullback.