Newsletter Subscribe
Enter your email address below and subscribe to our newsletter
Enter your email address below and subscribe to our newsletter
All voices matter
In the world of investing, few factors carry as much weight as interest rates. They influence everything from borrowing costs to corporate profits, and ultimately, the direction of stock prices. If you’re wondering how interest rates affect the stock market, you’re not alone—it’s a question that puzzles both novice traders and seasoned professionals. Drawing from years of market observation and analysis of economic trends, this guide breaks down the mechanics behind these shifts, helping you make smarter decisions in volatile times.
Whether rates are climbing due to inflation concerns or easing in response to economic slowdowns, understanding their ripple effects can give you an edge. We’ll explore the fundamentals, real-world examples, and strategies to navigate these changes, all while keeping things straightforward and actionable.
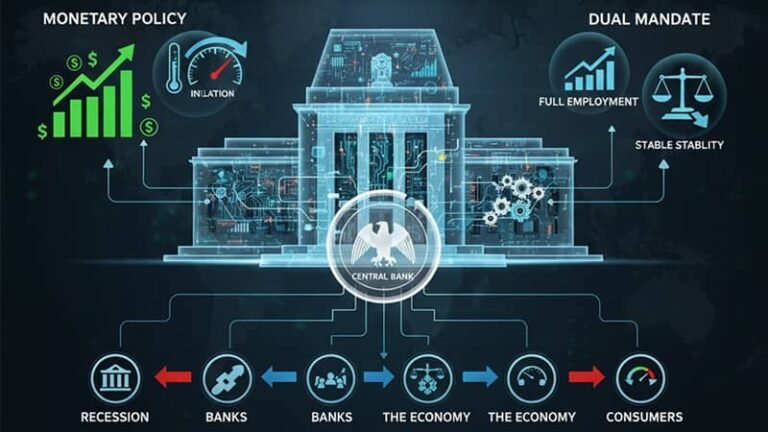
Interest rates represent the cost of borrowing money, set primarily by central banks like the Federal Reserve in the U.S. When the Fed adjusts its benchmark rate—the federal funds rate—it sends signals throughout the economy. Higher rates make loans more expensive, slowing down spending and investment. Lower rates do the opposite, encouraging growth.
But how do interest rates affect the stock market specifically? Stocks are valued based on future earnings potential. When rates rise, the “discount rate” used to calculate a company’s worth increases, making future profits seem less valuable today. This often leads to lower stock valuations. Conversely, falling rates reduce this discount, boosting stock prices as investors anticipate stronger growth.
Think of it like this: Imagine valuing a business that promises $100 in profits next year. At a 2% interest rate, that $100 is worth about $98 today. Bump the rate to 5%, and it’s only worth around $95. Small changes compound across the market, affecting trillions in assets.
When interest rates climb, the stock market often feels the pinch. Higher borrowing costs hit companies hard, especially those reliant on debt for expansion. Tech firms and growth stocks, which typically reinvest heavily, suffer the most because their valuations hinge on long-term projections that get discounted more severely.
For instance, during the Fed’s rate-hiking cycle in 2022, the S&P 500 dropped over 20% as investors fled high-valuation sectors like technology. Bond yields rose, offering safer returns without the volatility of stocks, pulling capital away from equities.
Key impacts include:
Not all hikes spell doom, though. If rates rise amid a strong economy, stocks might still rally on optimism. The key is context—watch inflation data and Fed statements closely.
On the flip side, when interest rates drop, it’s often party time for stocks. Cheaper borrowing stimulates economic activity, from homebuilding to business investments. This environment favors riskier assets, as investors seek higher returns than what’s available in bonds or savings accounts.
Look back to the post-2008 era: The Fed slashed rates to near zero, sparking a decade-long bull market. The Nasdaq surged over 500% as low rates propped up valuations in innovative sectors.
Benefits include:
However, prolonged low rates can inflate bubbles, as seen in the dot-com era. Savvy investors balance enthusiasm with caution, diversifying beyond overvalued areas.
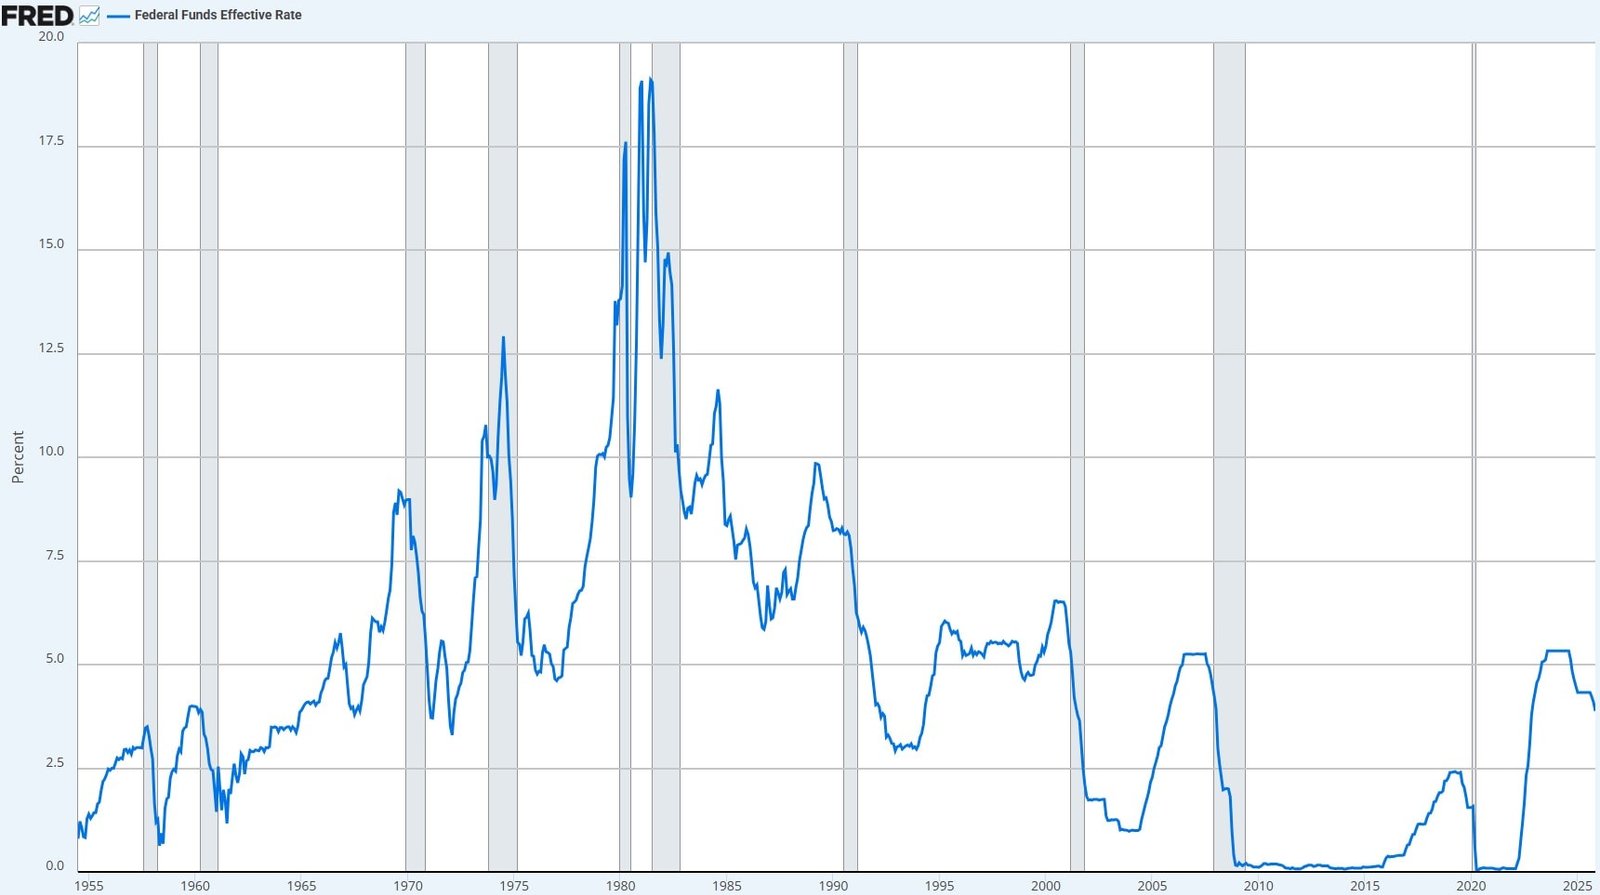
History offers clear patterns on how interest rates affect the stock market. During the 1980s, Paul Volcker’s aggressive rate hikes tamed inflation but triggered a recession and stock crash in 1987. Yet, the subsequent cuts paved the way for the 1990s boom.
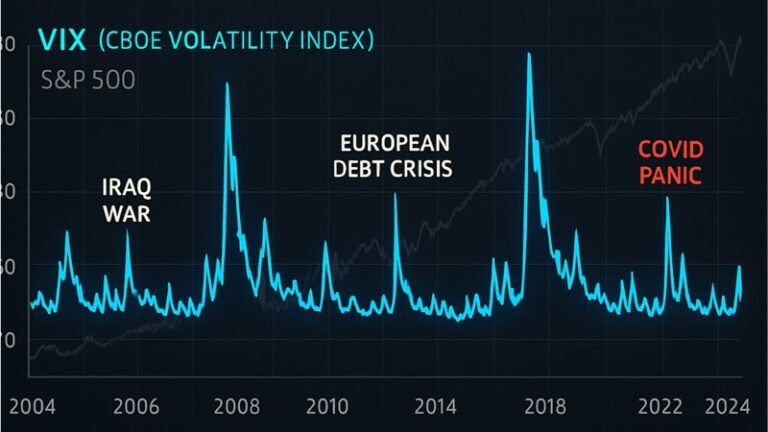
More recently, the COVID-19 pandemic saw rates plummet to historic lows, propelling a swift recovery in equities despite economic turmoil. As rates normalized in 2023-2024, markets wobbled but adapted, with AI-driven stocks leading the charge.
These cycles underscore a truth: Interest rate changes don’t happen in isolation. They interact with geopolitics, corporate earnings, and global events. Tracking indicators like the 10-year Treasury yield can provide early warnings.
To make this clearer, here’s a table outlining how various sectors typically respond to interest rate shifts. This isn’t a crystal ball—market reactions vary—but it highlights trends based on decades of data.
| Rate Environment | Growth Stocks (e.g., Tech) | Value Stocks (e.g., Banks) | Defensive Stocks (e.g., Utilities) | Overall Market Sentiment |
|---|---|---|---|---|
| Rising Rates | Negative: Higher discounts erode valuations; borrowing costs rise. | Mixed: Banks benefit from wider net interest margins, but others struggle. | Positive: Stable dividends attract income seekers. | Cautious; potential for corrections. |
| Stable Rates | Neutral: Predictability supports steady growth. | Neutral: Consistent lending environment. | Neutral: Reliable but unexciting. | Balanced; focuses on fundamentals. |
| Falling Rates | Positive: Fuels expansion and risk-taking. | Positive: Lower costs boost lending and profits. | Neutral: Less appealing vs. growth opportunities. | Optimistic; bull runs common. |
Data drawn from Federal Reserve reports and market analyses over the past 30 years.
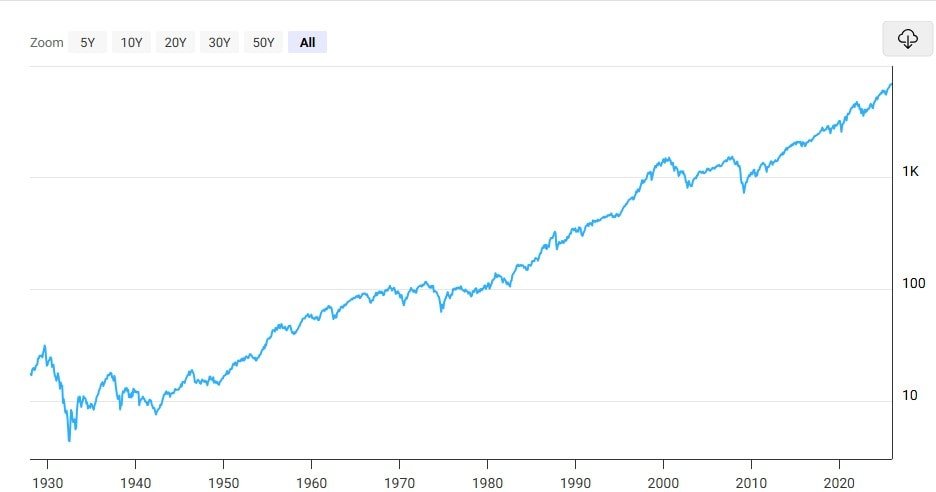
Stock Market Proxy: S&P 500 Total Return
Interest Rate Proxy: U.S. Policy Rates / Federal Funds Rate (or equivalents pre-1954)
| Period | Stock Market Performance | Interest Rate Environment | Observed Relationship |
|---|---|---|---|
| 1926–1929 | Strong bull market | Moderate rates | Credit expansion supported equity speculation |
| 1929–1932 | Severe collapse (Great Depression) | Rates fell, but credit tightened | Falling rates could not offset economic contraction |
| 1933–1939 | Strong recovery | Very low rates | Monetary easing supported valuation recovery |
| 1940–1950 | Steady gains | Controlled / low rates | Post-war growth outweighed rate impact |
| 1950–1965 | Strong long-term returns | Gradually rising rates | Economic growth dominated rate headwinds |
| 1966–1981 | Flat to weak real returns | Rapidly rising rates (high inflation) | High rates compressed equity valuations |
| 1982–2000 | Historic bull market | Rates declined structurally | Falling rates expanded P/E multiples |
| 2000–2002 | Dot-com crash | Rates cut aggressively | Rate cuts lagged equity collapse |
| 2003–2007 | Bull market | Gradual rate hikes | Stocks rose despite tightening |
| 2008–2009 | Global Financial Crisis | Rates cut to near zero | Monetary easing stabilized markets |
| 2010–2019 | Long bull market | Ultra-low rates | Cheap capital boosted asset prices |
| 2020–2021 | Sharp rebound | Zero-rate policy | Liquidity surge drove valuation expansion |
| 2022 | Bear market | Rapid rate hikes | Rising rates pressured growth stocks |
| 2023–2025 | Recovery / new highs | Rates peaked, easing expectations | Markets priced future rate cuts |
So, how can you position yourself? First, diversify—don’t put all eggs in growth baskets during hikes. Consider bonds or dividend aristocrats for stability.
Second, stay informed. Tools like the CME FedWatch help gauge rate expectations. If hikes loom, trim leverage and focus on quality companies with strong balance sheets.
Third, think long-term. Rate cycles are temporary; compounding returns endure. For example, buying during 2022’s dip paid off handsomely by 2024.
Ultimately, while interest rates affect the stock market profoundly, they’re one piece of the puzzle. Combine this knowledge with your risk tolerance and goals for better outcomes.
Interest rates are a powerful force, shaping the stock market in ways that can create opportunities or pitfalls. By grasping these dynamics—rising rates often cool markets, while cuts ignite them—you’ll be better equipped to adjust your portfolio. Remember, no strategy is foolproof, but informed action beats reactive panic.
If you’re investing amid uncertainty, consult a financial advisor. Markets reward patience and insight, so keep learning and adapting. What’s your take on the current rate outlook? Share in the comments below.