Newsletter Subscribe
Enter your email address below and subscribe to our newsletter
Enter your email address below and subscribe to our newsletter
All voices matter
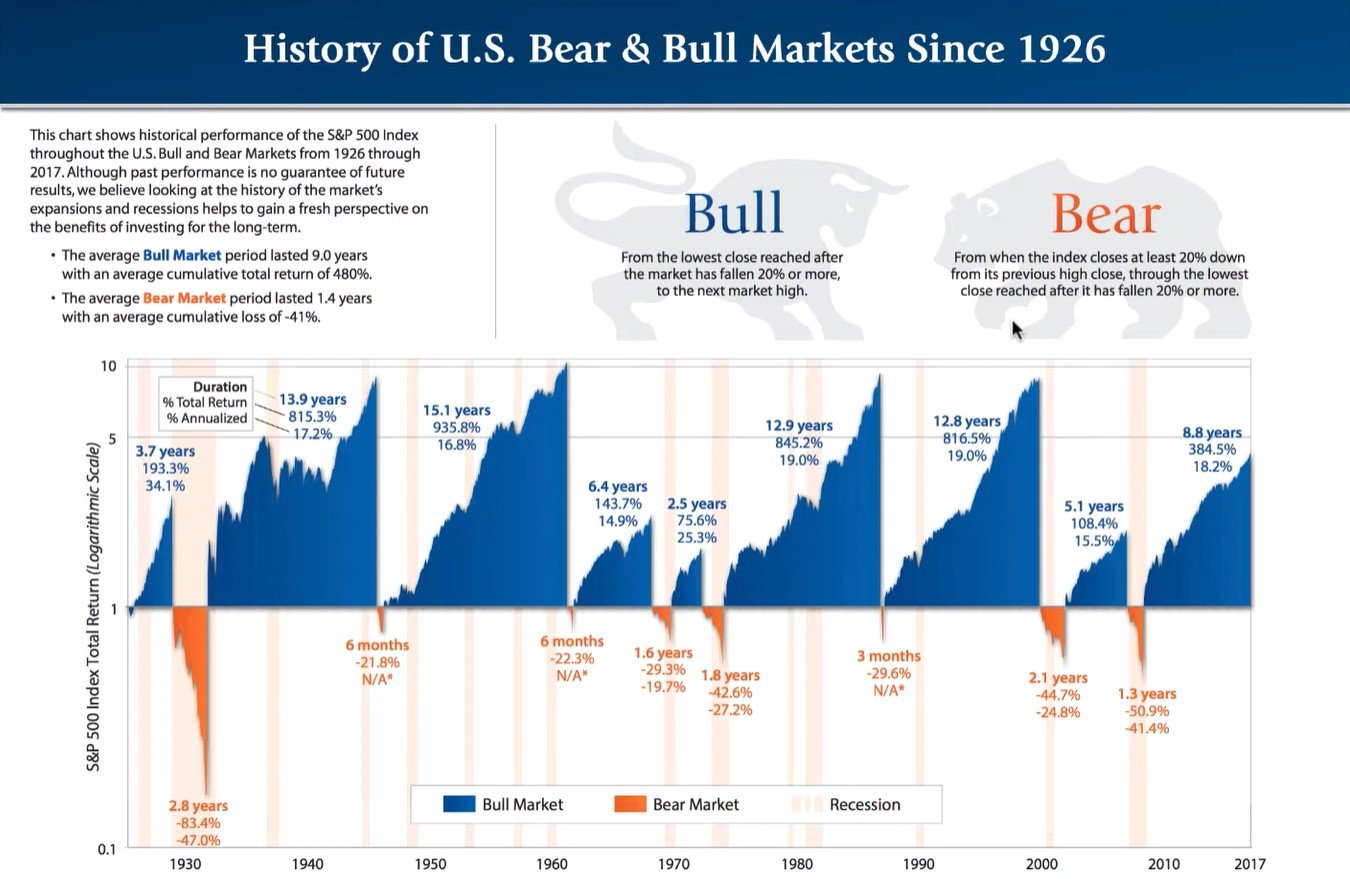
In the narrative of global finance, the U.S. stock market serves as the ultimate stage for the perennial battle between the Bull and the Bear. While modern headlines often obsess over daily fluctuations, the real story of wealth creation is written in the broad, sweeping cycles of expansion and contraction that have defined the American economy for over a century.
Understanding the history of bull and bear markets isn’t just an academic exercise—it is the foundational “cheat code” for long-term investing. By studying the patterns of the past, we can strip away the noise of the present and see the market for what it truly is: a resilient engine of growth that periodically clears the brush to make way for new life.
Before diving into the specific eras, we must establish the “Golden Rules” of market identification. In the professional world of Wall Street, these are not just vibes; they are mathematically defined phases.

Since the end of the Great Depression, the U.S. has experienced some of the most prolific wealth-building periods in human history. These eras were defined by more than just numbers; they were fueled by systemic shifts in technology and policy.
Following WWII, a surge in American consumerism and the “Baby Boom” created a bedrock for growth. The S&P 500 saw a cumulative return of approximately 266% during this period.
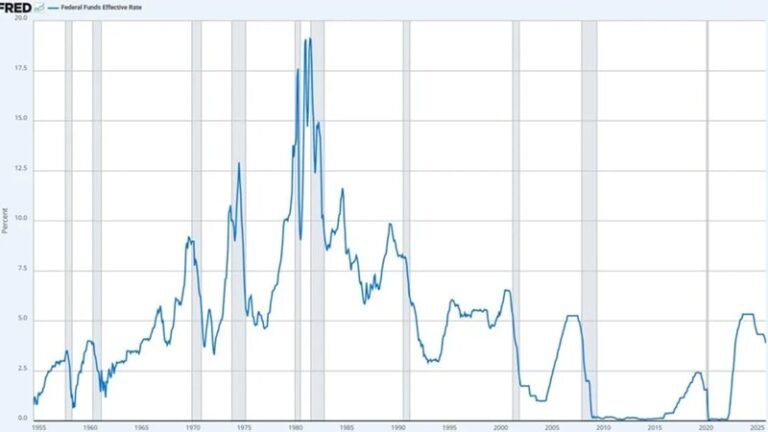
After a decade of “stagflation” in the 70s, the early 80s brought falling interest rates and aggressive tax cuts. This bull run delivered a 228% return before being interrupted by the 1987 “Black Monday” crash.
Perhaps the most famous bull market in history. The rise of the World Wide Web transformed the DJIA from a sleepy industrial tracker into a rocket ship, gaining 582%. It only ended when valuations for companies without profits finally became unsustainable.
The longest bull market in U.S. history lasted nearly 11 years. Fueled by low interest rates (QE) and the dominance of “Big Tech” (Apple, Amazon, Google), the market climbed 400% before the COVID-19 black swan event brought it to a screeching halt.
Bear markets are the “price of admission” for the gains of the bull. While they feel catastrophic in the moment, history shows they are significantly shorter and less impactful than the bull runs they follow.
| Era | Trigger / Cause | S&P 500 Decline | Duration |
| 1929–1932 | The Great Depression | -86% | 33 Months |
| 1973–1974 | OPEC Oil Embargo / Stagflation | -48% | 21 Months |
| 1987 | “Black Monday” (Program Trading) | -33% | 3 Months |
| 2000–2002 | Dot-Com Bubble Burst | -49% | 30 Months |
| 2007–2009 | Global Financial Crisis (Subprime) | -56% | 17 Months |
| 2020 | COVID-19 Global Shutdown | -34% | 1 Month |
| 2022 | Post-Pandemic Inflation / Rate Hikes | -25% | 9 Months |
One of the most profound realizations for any investor is the historical asymmetry between bulls and bears.
In other words, the “Bull” works longer and harder than the “Bear.” Since 1928, the S&P 500 has spent roughly 78% of the time in a bull market. While the bear market swipes are violent and headline-grabbing, they are statistically the minority of the market’s life cycle.
As we look at 2025, the U.S. market continues to wrestle with high interest rates and the “AI Boom.” History suggests that we are currently in a transition phase. Whether we are in the late stages of a “Mature Bull” or the early stages of a “Cyclical Bear,” the strategy remains the same: Stay the course.
The investors who “won” the Dot-Com crash or the 2008 Financial Crisis weren’t those who predicted the bottom perfectly—they were the ones who didn’t sell their quality assets at the bottom. History proves that every single bear market in U.S. history has eventually been followed by a new all-time high.