Newsletter Subscribe
Enter your email address below and subscribe to our newsletter
Enter your email address below and subscribe to our newsletter
All voices matter
In today’s volatile markets, picking the right stocks isn’t about gut feelings or hot tips—it’s about a disciplined, methodical approach that uncovers real value and minimizes risks. Whether you’re a novice investor building your first portfolio or a seasoned trader refining your strategy, understanding how to analyze a stock step by step can transform your results. This guide draws from proven techniques used by professionals, breaking it down into actionable phases so you can confidently evaluate any company and decide if it’s worth your hard-earned money.
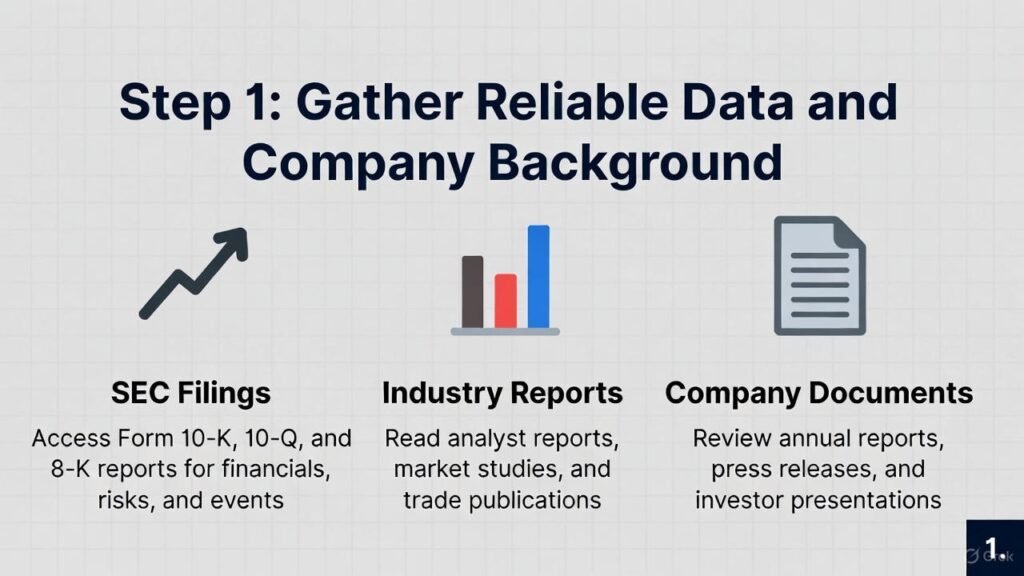
Before diving into numbers or charts, start with solid groundwork. The foundation of any stock analysis is accurate, up-to-date information straight from credible sources. Skip the rumors on social media and head to official documents like the company’s 10-K and 10-Q filings on the SEC’s EDGAR database—these annual and quarterly reports offer unfiltered insights into operations, risks, and financials. Pull the latest earnings calls, press releases, and analyst reports from sites like Yahoo Finance or the company’s investor relations page. Don’t forget to scan recent news for red flags, such as lawsuits or leadership changes.
In practice, I always cross-reference this with industry reports from sources like Morningstar or Bloomberg to get context. For example, if you’re eyeing a tech stock like a semiconductor firm, check how supply chain issues or trade policies might play out. This step typically takes 30-60 minutes but saves hours later by focusing your efforts on viable candidates.
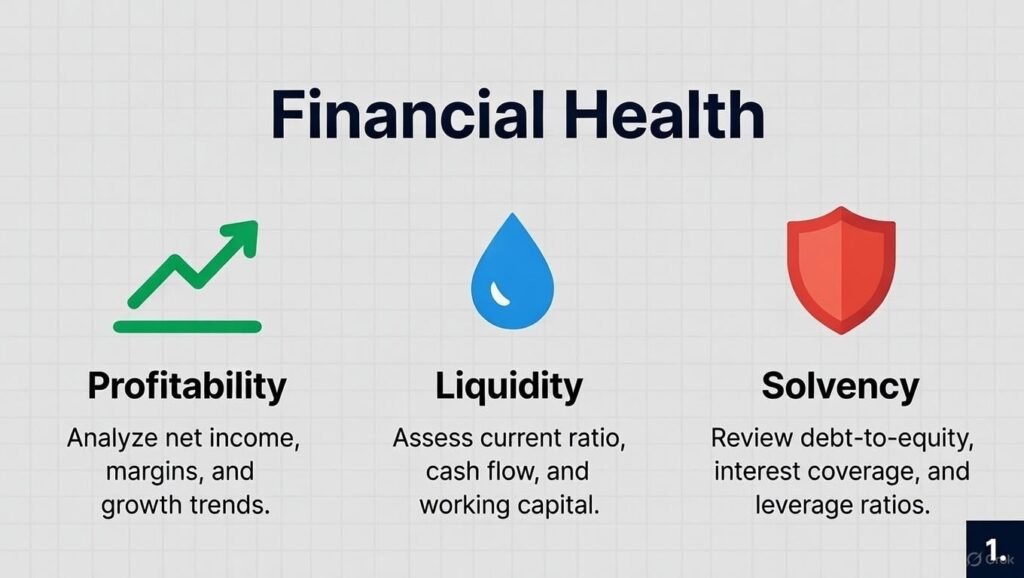
Once you have the data, zero in on the company’s core financials—this is where fundamental analysis shines, revealing if the business is truly sound or just hype. Review the three key statements: the income statement for revenue and profits, the balance sheet for assets versus liabilities, and the cash flow statement to see how money moves in and out.
Calculate essential ratios to benchmark performance. A low price-to-earnings (P/E) ratio might signal undervaluation, while a high debt-to-equity ratio could warn of overleverage. Compare these to industry averages; for instance, a software company’s P/E of 25 might be reasonable, but the same for a utility firm could scream overpriced. Look at trends over the past 3-5 years—consistent revenue growth above 10% annually is a green light for expansion potential.
From my experience, ignoring cash flow is a common pitfall. A company posting big profits but burning cash on operations (negative free cash flow) often spells trouble down the line. Tools like Excel or free screeners on Fidelity’s platform make this straightforward.
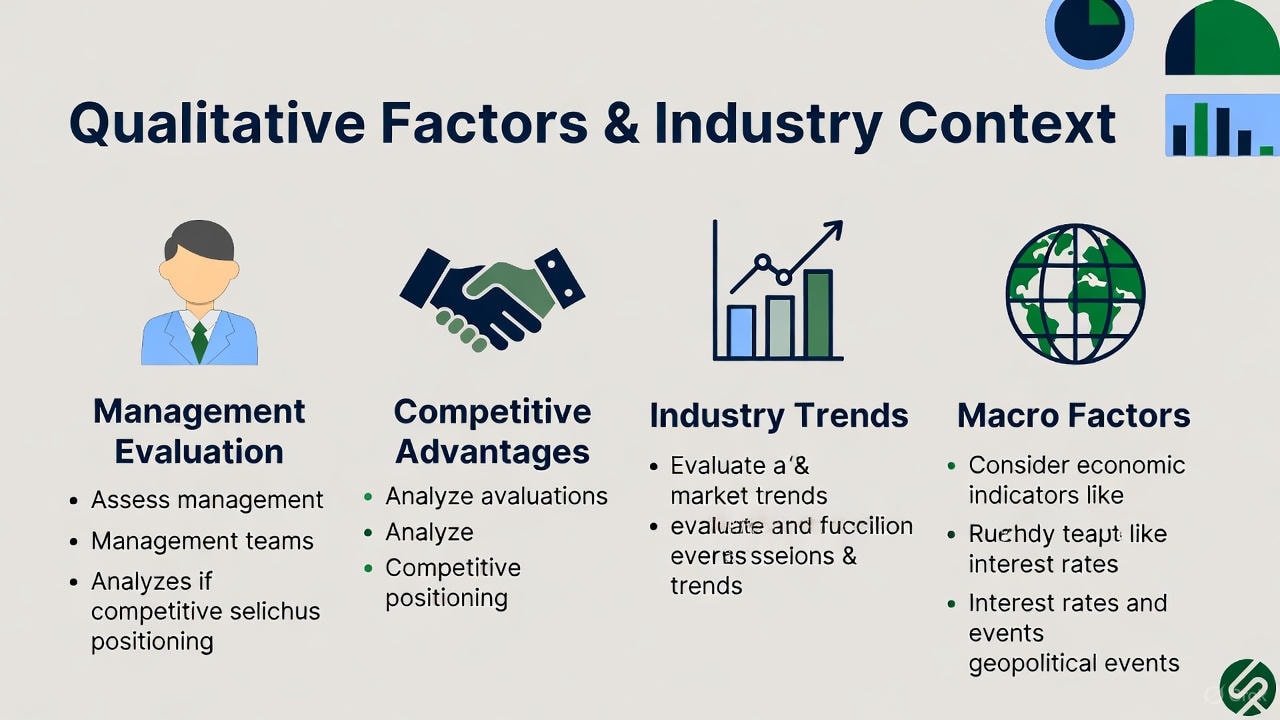
Numbers tell part of the story, but qualitative analysis uncovers the “why” behind them. Evaluate the management team—have they delivered on promises before? Check their track record via LinkedIn or past earnings transcripts. Assess competitive advantages, or “moats,” like strong brands (think Coca-Cola) or patents that fend off rivals.
Broaden your view to the industry: Is it growing, like renewable energy, or facing headwinds, such as traditional retail battling e-commerce? Factor in macro elements too—rising interest rates hurt debt-heavy firms, while economic booms lift cyclicals. I’ve seen investors overlook this and get burned; for example, airline stocks tanked during the pandemic despite solid balance sheets pre-crisis.
Combine this with sentiment checks from news aggregators or social media tools like StockTwits, but take it with a grain of salt—crowds can be wrong.
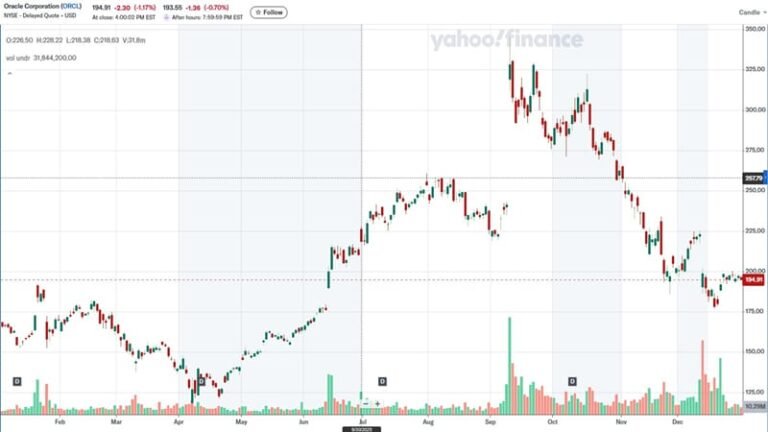
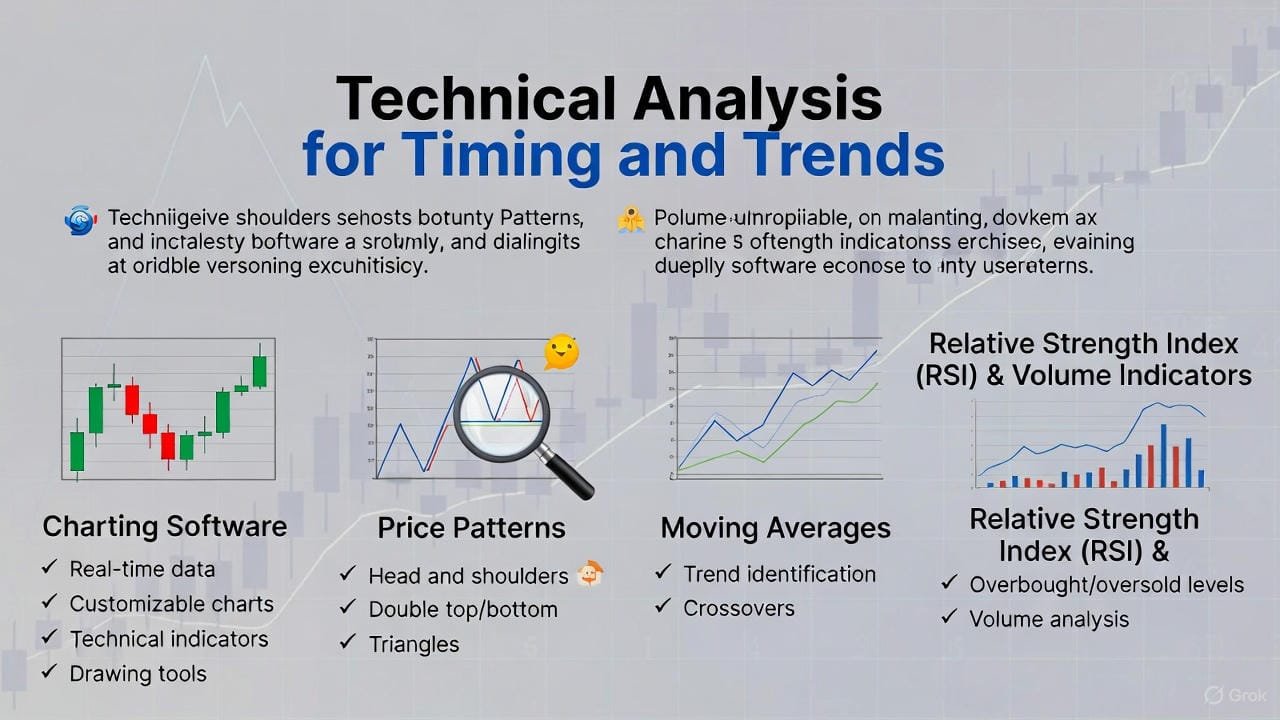
For short-term plays or entry/exit points, technical analysis steps in, focusing on price action and market psychology rather than fundamentals. Use charting software like TradingView to plot historical prices, spotting patterns such as head-and-shoulders for reversals or breakouts above resistance levels.
Key indicators include moving averages (e.g., 50-day and 200-day for trend confirmation) and the Relative Strength Index (RSI) to gauge overbought (above 70) or oversold (below 30) conditions. Volume is crucial—rising prices on high volume confirm strength. In one case I recall, a stock’s breakout on triple average volume signaled a 20% rally ahead.
Technicals aren’t foolproof; they work best alongside fundamentals. Pros use them to time buys in undervalued stocks from Step 2, avoiding purchases during downtrends.
Now, estimate the stock’s intrinsic value to see if it’s a bargain. Methods like discounted cash flow (DCF) project future earnings and discount them back to today—use online calculators if spreadsheets intimidate you. Compare to simpler multiples: A PEG ratio under 1 suggests growth at a fair price.
Weigh risks: What if competition intensifies or regulations change? Stress-test scenarios, like a 20% revenue drop, and calculate potential downside. Diversification helps here—never put more than 5-10% of your portfolio in one stock.
The table below summarizes key financial ratios to monitor during analysis, with ideal ranges for most sectors:
| Ratio | Formula | Ideal Range (General) | What It Tells You |
|---|---|---|---|
| Price-to-Earnings (P/E) | Stock Price / EPS | 15-25 | Valuation relative to earnings; lower may indicate undervaluation |
| Debt-to-Equity | Total Debt / Shareholders’ Equity | Under 1.0 | Leverage level; higher means more risk from debt |
| Return on Equity (ROE) | Net Income / Shareholders’ Equity | Over 15% | Profit efficiency; high shows good management |
| Current Ratio | Current Assets / Current Liabilities | Over 1.5 | Short-term liquidity; below 1 flags cash issues |
| Dividend Yield | Annual Dividend / Stock Price | 2-4% | Income potential; too high might be unsustainable |
Adjust these based on industry—tech firms often have higher P/E due to growth prospects.
Synthesize everything: Does the stock’s strengths outweigh risks at the current price? If yes, buy with a plan—set stop-loss orders to limit losses. If not, move on; there are thousands of options.
Post-purchase, revisit quarterly. Markets evolve, so annual re-analysis keeps you ahead. In my career, this ongoing vigilance has helped clients dodge downturns and capture upswings.
Mastering how to analyze a stock step by step empowers you to invest with confidence, not speculation. Start small, practice on familiar companies, and remember: No analysis guarantees wins, but this framework stacks the odds in your favor. If you’re ready to apply it, pick a stock today and run through these steps—you might just uncover your next winner.