Newsletter Subscribe
Enter your email address below and subscribe to our newsletter
Enter your email address below and subscribe to our newsletter
All voices matter
In the fast-paced world of investing, understanding the broader market dynamics can make all the difference between spotting a genuine rally and falling for a deceptive uptick. Market breadth, often overlooked by novice traders, serves as a critical lens for assessing the overall strength or weakness of the stock market. It’s not just about watching major indices like the S&P 500 or Dow Jones; it’s about diving deeper into how many stocks are truly participating in the movement. If you’ve ever wondered why the market seems bullish on the surface but feels shaky underneath, market breadth indicators could be the key to unlocking those insights.
In this guide, we’ll break down what market breadth really means, explore its most reliable indicators, and discuss practical ways to incorporate it into your investment decisions. Whether you’re a day trader, long-term investor, or just curious about market mechanics, this explanation will equip you with the tools to read the market more accurately.
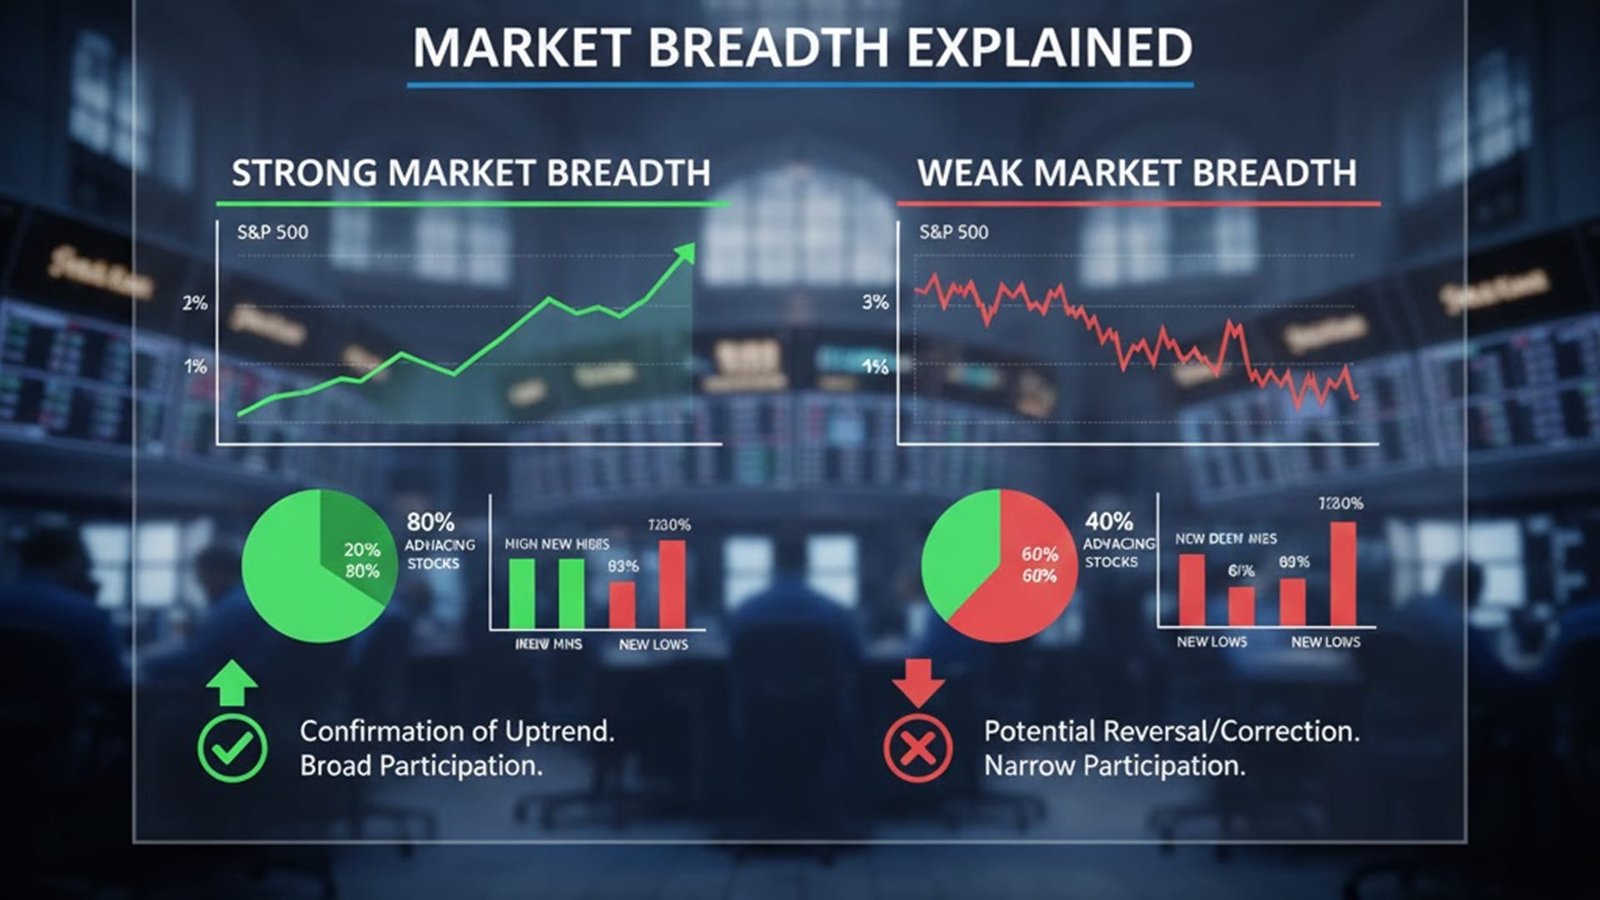
At its core, market breadth measures the level of participation in a market trend. Think of it as checking the pulse of the entire stock universe rather than relying solely on headline-grabbing indexes. When the S&P 500 rises, for instance, it might be driven by a handful of mega-cap tech stocks like Apple or Nvidia. But if the majority of stocks are lagging or even declining, that’s a red flag—the rally lacks breadth.
This concept isn’t new; it’s been a staple in technical analysis since the early days of Wall Street. Market breadth helps differentiate between broad-based advances, where most stocks are climbing together, and narrow advances, where only a few heavyweights are propping up the index. In my experience, markets with strong breadth tend to sustain trends longer, while those with weak breadth often signal impending reversals or corrections.
To put it simply, breadth indicators reveal the “under-the-hood” story of the market. They’re especially useful in volatile periods, like during economic recoveries or ahead of recessions, when surface-level data can be misleading.
There are several tried-and-true indicators that professionals use to gauge market breadth. Each one offers a unique perspective, and combining them can provide a more robust view. Here’s a closer look at the most important ones, based on years of observing how they play out in real-world scenarios.
The Advance-Decline Line is perhaps the most straightforward breadth measure. It tracks the net difference between the number of advancing stocks (those closing higher) and declining stocks (those closing lower) on a given exchange, like the NYSE. Over time, this cumulative line can diverge from major indexes, signaling potential trouble.
For example, if the Dow is hitting new highs but the A/D Line is flat or trending down, it suggests the advance is concentrated in fewer stocks— a classic sign of market fragility. I’ve used this in client portfolios to time exits from overextended rallies.
This indicator compares the number of stocks reaching 52-week highs versus those hitting 52-week lows. A healthy market shows more new highs than lows, indicating widespread optimism. Conversely, a spike in new lows during an uptrend can foreshadow a downturn.
In practice, watching the 10-day or 30-day moving average of this ratio helps smooth out daily noise and spot emerging trends.
Volume adds weight to price movements, and the Up/Down Volume Ratio does just that for breadth. It divides the total volume of advancing stocks by the volume of declining ones. Ratios above 1 signal bullish breadth, while those below point to bearish undercurrents.
This is particularly insightful during earnings seasons, where volume surges can reveal true market sentiment beyond price alone.
To make this more concrete, let’s look at a simple comparison of these indicators in a table format. This overview draws from historical data patterns I’ve analyzed across multiple market cycles.
| Indicator | What It Measures | Bullish Signal | Bearish Signal | Best Use Case |
|---|---|---|---|---|
| Advance-Decline Line | Net advancing vs. declining stocks | Rising line with index highs | Diverging downward from index | Spotting trend sustainability |
| New Highs vs. New Lows | Stocks at 52-week highs vs. lows | More highs than lows | More lows during uptrends | Identifying market tops/bottoms |
| Up/Down Volume Ratio | Volume in advancing vs. declining stocks | Ratio > 1 consistently | Ratio < 1 during rallies | Gauging conviction in price moves |
| McClellan Oscillator | Smoothed A/D data for overbought/oversold | Positive and rising | Negative and falling | Short-term timing |
Note: Data like this isn’t foolproof, but when aligned with other factors like economic reports, it can guide smarter decisions.
Knowing the indicators is one thing; applying them effectively is another. Start by integrating breadth analysis into your daily routine. For instance, platforms like TradingView or Bloomberg offer free or premium tools to chart these metrics alongside your favorite indexes.
In bullish markets, confirm strength with broad participation—aim for at least 60-70% of stocks advancing on up days. If breadth weakens, consider lightening positions or hedging with options. During bear markets, look for breadth improvements as early signs of recovery, such as a surge in new highs.
One strategy I’ve recommended to clients is the “breadth thrust” signal, popularized by market veterans like Martin Zweig. This occurs when the 10-day advance-decline ratio spikes dramatically, often indicating the start of a major bull run. Historically, these have preceded strong returns, but always cross-reference with fundamentals like interest rates or earnings growth.
Remember, no single indicator is a crystal ball. Combine breadth with other analyses—technical, fundamental, and sentiment-based—for a well-rounded approach. This holistic view has helped me navigate events like the 2020 COVID crash and the subsequent rebound.
Even seasoned investors trip up here. A big misconception is that breadth only matters in large-cap indexes. In reality, it’s crucial across all markets, including small-caps or international exchanges. Another pitfall: over-relying on short-term data. Daily fluctuations can be noisy; focus on weekly or monthly trends for clearer signals.
Also, don’t ignore sector-specific breadth. Tech might be soaring while energy lags— that’s not true market health. Tools like sector A/D lines can drill down further.
With algorithmic trading and passive ETFs dominating, markets can appear healthier than they are. The 2021-2022 period illustrated this perfectly: indexes climbed on FAANG strength, but breadth warned of the impending sell-off. Today, as we face inflation uncertainties and geopolitical tensions, monitoring breadth is non-negotiable for protecting capital.
If you’re building a portfolio, use breadth to decide allocation—favor diversified holdings in strong-breadth environments, or concentrate in leaders during weak ones. Ultimately, this knowledge empowers you to act with confidence, avoiding the herd mentality that often leads to losses.
In wrapping up, market breadth isn’t just technical jargon; it’s a practical edge for any investor serious about long-term success. By mastering these concepts, you’ll be better positioned to spot opportunities and sidestep risks. If you’re ready to dive deeper, check out resources from the NYSE or veteran analysts like Lowry’s Reports for real-time data. What’s your take—have you used breadth indicators in your trades? Share in the comments below.